Danone employs more than 100,000 people across 57 countries. Cultivating a development-focused mindset amongst their employees is a top priority, so they launched “Campus X” in 2019. This initiative offered learners on-demand access to a wealth of learning resources via Danone’s ecosystem, which connects their LXP with their LMS, with underlying content from various platforms. Learners have unlimited access to these on-demand resources, which include a mixture of internal and externally sourced content.
Campus X offered considerable improvement to the learner with easy access to more content than ever before. However, it also presented challenges in terms of handling the data, which was scattered across several platforms, could not be manually consolidated, and—crucially—lacked the visibility for analysis.
Danone recognized their learning would always take place across multiple platforms and systems, as each platform is specialized to meet unique learner needs. Their ecosystem had a wealth of learner activity, but there was no central view to understand learner activity or system usage.
The data across the ecosystem (including non-learning sources such as HRIS data) came in a variety of formats. Danone identified that data needed to be aggregated, cleansed, and sorted using a Learning Record Store (LRS). By converting all data into xAPI format, the data can “speak” a single language. This ensures reliable, ecosystem-wide datasets that can be turned into meaningful insights via reports accessed in a Learning Analytics Platform (LAP).
“When Campus X launched, it became clear we needed a centralized view of our ecosystem data to support projects such as our Learning Engagement Index,” said Frédéric Hebert, Digitalization Stream Lead Talent and Learning, Danone.
"By connecting our ecosystem using an LRS, we’re opening our doors to an exciting, ‘big-data’ approach. We can now measure and benchmark learner KPIs; we’re laying the foundations that shift us to an insights-driven, analytical world of L&D.
Already, we have new insights on ‘shadow learning’ [user-generated eLearning] that we never thought could be tracked, but more excitingly, we’ll have the data we need to enable future initiatives such as predictive learning and sentiment analysis.”
By connecting their ecosystem and enabling central reporting, Danone’s learning leaders now have data centrally pooled for easy insights. To collect, cleanse, and aggregate this data across their global network, it would have cost an estimated €120,000 per year—assuming only one day of manual work, per region, per week.
The Challenge
One specific metric group that demonstrates Danone’s need for centralized reporting is their Learning Engagement Index. This index tracks a series of KPIs throughout the learning journey—such as consumption, time on platform, shares, comments, and more.
These KPIs would build a picture of an individual’s progress—and engagement—with learning over time. Danone can use this aggregated data to benchmark these various KPIs and ensure learner goals are set at the right level to help their learners flourish.
Danone recognized to shift to an L&D function that goes beyond basic reporting on productivity outputs (such as completions) to one focused on building the right capabilities, they needed data to:
- be centrally stored and accessed in one place,
- span all parts of the learning ecosystem, and
- cover minute details of learner interactions.
xAPI (Experience API), the interoperability specification that covers the minute details of learner interactions, already exists. However, their learning systems and platforms recorded data in different formats, with only 2 out of their 7 major platforms being xAPI conformant.
The existing systems within their learning ecosystem all play a specific role and purpose, meeting different learner needs. So to store the data centrally with reliable data fidelity, a Watershed connector was required for each platform within the ecosystem.
| Platform | Purpose | Data Format |
|---|---|---|
| SuccessFactors | HRIS Data | CSV |
| EdCast | Learning Experience Platform - Danone has been using EdCast for 3 years and was one of Europe’s earliest and largest LXP adopters. | API |
| Cornerstone OnDemand (LMS) | Learning Management System (LMS) | API |
| EasyGenerator | Authoring tool - A platform where SCORM courses are uploaded and users can access them. | Direct xAPI statements |
| Coursera | Online courses & certificates | API > CSV |
| LinkedIn Learning | Online courses, tagged with skills | API > CSV and also direct xAPI statements |
| Get Abstract | Content library - 15-minute summaries of business books in text & audio format | Direct xAPI statements |
Solution
The solution for Danone started with mapping their learning ecosystem. This process gave visibility to the data types that each core platform used to create and deliver the learning across Danone’s global populations. This created the scope for the quantity and type of connections required to connect their ecosystem, which in turn would allow centralized reporting.

Matching HRIS data with learning data
Connecting data from across learning platforms is just one half of the puzzle. The real power of Watershed comes when it’s integrated with Danone’s HRIS data. By assigning a unique learner ID to each employee, Danone can map employee interactions across the entire learning ecosystem.
This plays a few essential roles:
- Watershed’s "persona concept" allows you to map multiple ‘"learner identifiers" to a single persona within Watershed. This allows a central view of all learner activity, regardless of which platform or system they used. This is an essential step as each learner is likely to have a unique identifier for each system or platform they use (one in an LMS, one in HRIS etc).
- It enables the creation of comprehensive learner transcripts, where every learner interaction across the ecosystem can be tracked and viewed in a user’s dashboard. This is great for line managers and essential here for Danone to create their Learning Engagement Index.
- It ensures data fidelity and avoids “duplicating” learner interactions, which is essential when users access various platforms (for Danone primarily through EdCast, their LXP).
- It meets strict European data privacy standards. Watershed allows users to assign access to reports according to job role to ensure employee data is handled correctly (i.e., a manager can only view their direct employee reports, while aggregated data could be visible to all).
- It allows reports (e.g., course completions, time on platform, etc.) to be viewed at all possible levels of the organization’s hierarchy:
- as a whole organization;
- by geographical territories, department, team, and job role; or
- all the way down to the individual learner.
Converting all data sources into a consistent format
As shown in the table above, not all tools can send xAPI statements. For analytics to work across the entire ecosystem, Watershed converts non-xAPI data into data in one of two ways:
- Manual setup: Watershed’s team of data experts convert the non-xAPI data into xAPI using templated CSV uploads or completely automated processes of scheduled API calls (via Watershed’s Data Conversion Engine).
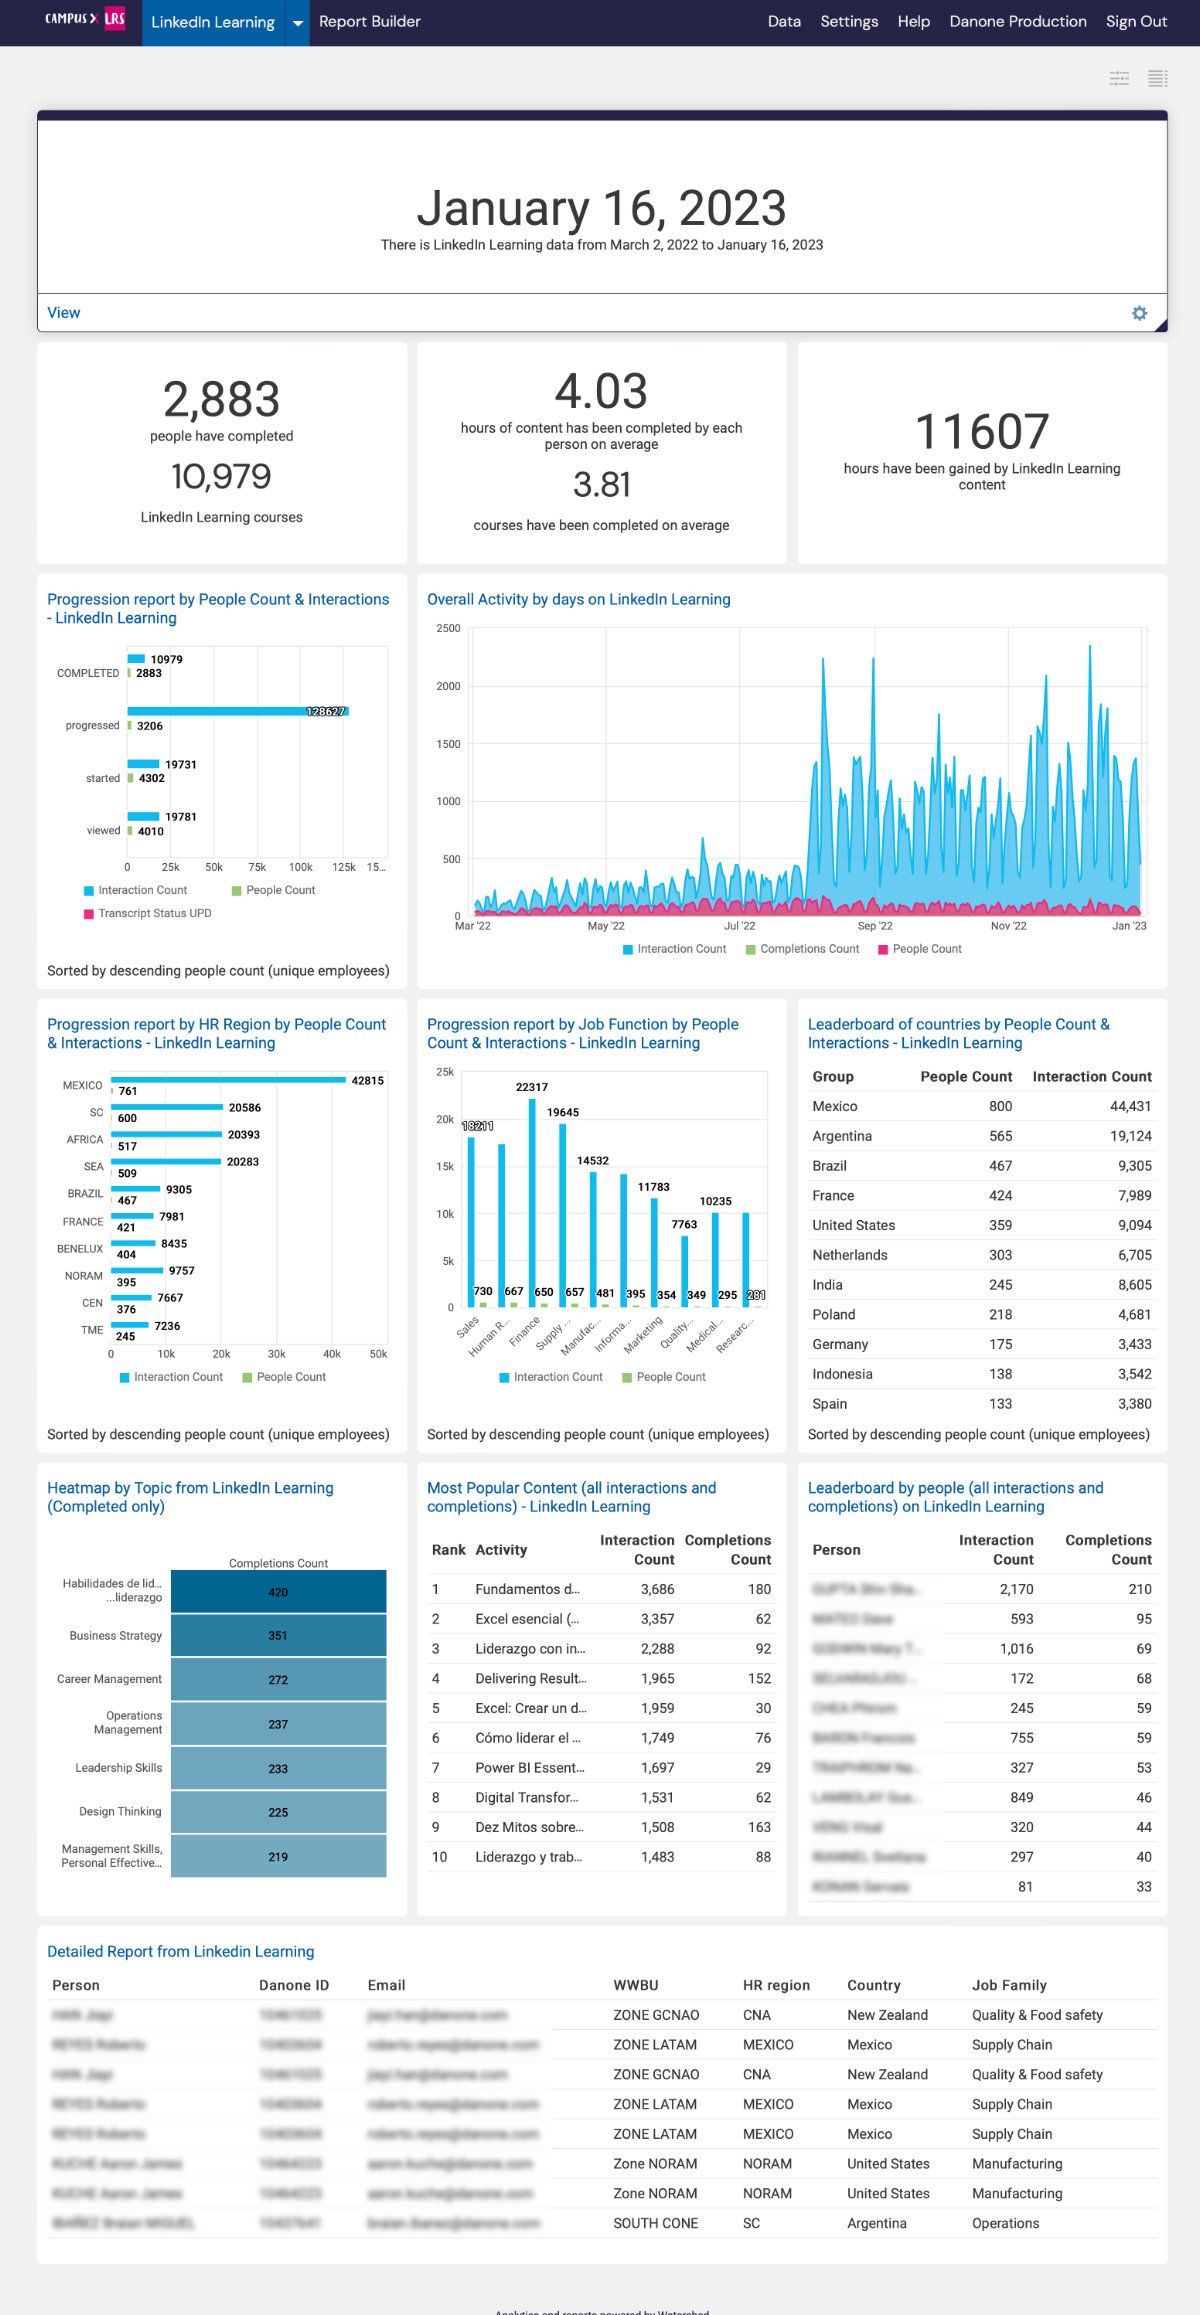
- Automated connections using Works with Watershed: These connections offer a far quicker implementation, as they are reusable, tried-and-tested connections that don’t need to be built from scratch or heavily modified. Three of Danone’s core platforms use these pre-built connectors: EdCast, Coursera, and LinkedIn Learning.
Cleansing data for consistent, accurate reporting
Once the connections were complete, each data source underwent extensive testing in both a UAT environment and then with live data sets into the production environment.
Whenever you handle large quantities of data—especially when the data is in different formats from across a legacy of learning tools and systems—bad data is bound to find its way in. It goes without saying that reliable data is essential for reporting accuracy. False starts caused by a lack of data integrity are one of the quickest ways L&D can lose the trust of the C-Suite.
Any bad data is corrected using activity and verb aliasing tools to update misspelled words, merge verb IDs, and combine disparate activities. Once you’ve aliased specific words, activities, or verbs, all past and future data will continue to update automatically.
For example, the initial setup for Danone’s Cornerstone connector used middleware, however it is currently being switched over to Watershed's reusable connection as this offers improved data fidelity, and ultimately a more reliable connection.
Results
Easy-to-use reports in dashboards that visualize the data
Watershed’s reports are contained in dashboards that contain individual reports based on different KPIs. Users can view the same data sets in multiple ways (e.g. pie chart, line graph, etc). This small but important feature makes consuming the data easier according to individual taste.
Examples of Danone’s dashboards include:
- My Training History dashboard - contains reports relating to an individual employee
- Regulatory reporting dashboard - contains employee engagement reports
- Platform-specific dashboards for each connected data source
- New insights into “Shadow Learning” showcase the power of user-generated content
Danone encourages employees to create their own eLearning using EasyGenerator. This approach can be a particularly effective way of engaging learners, as the content is created by those “on the frontlines.” Peer-to-peer learning accounts for a large part of informal learning, as the authors are often trusted by peers and their content (such as scenarios) can be highly relatable.
This approach also allows SMEs to create content with minimal impact on central L&D resources. Most importantly, Danone’s learning leaders now have the ability to figure out the impact of shadow learning over time. For example, Danone’s reports currently show Sales team members have completed the most courses in EasyGenerator, while Danoners in Mexico have created the most courses to date.
Connecting the ecosystem to launch Danone’s Learning Engagement Index
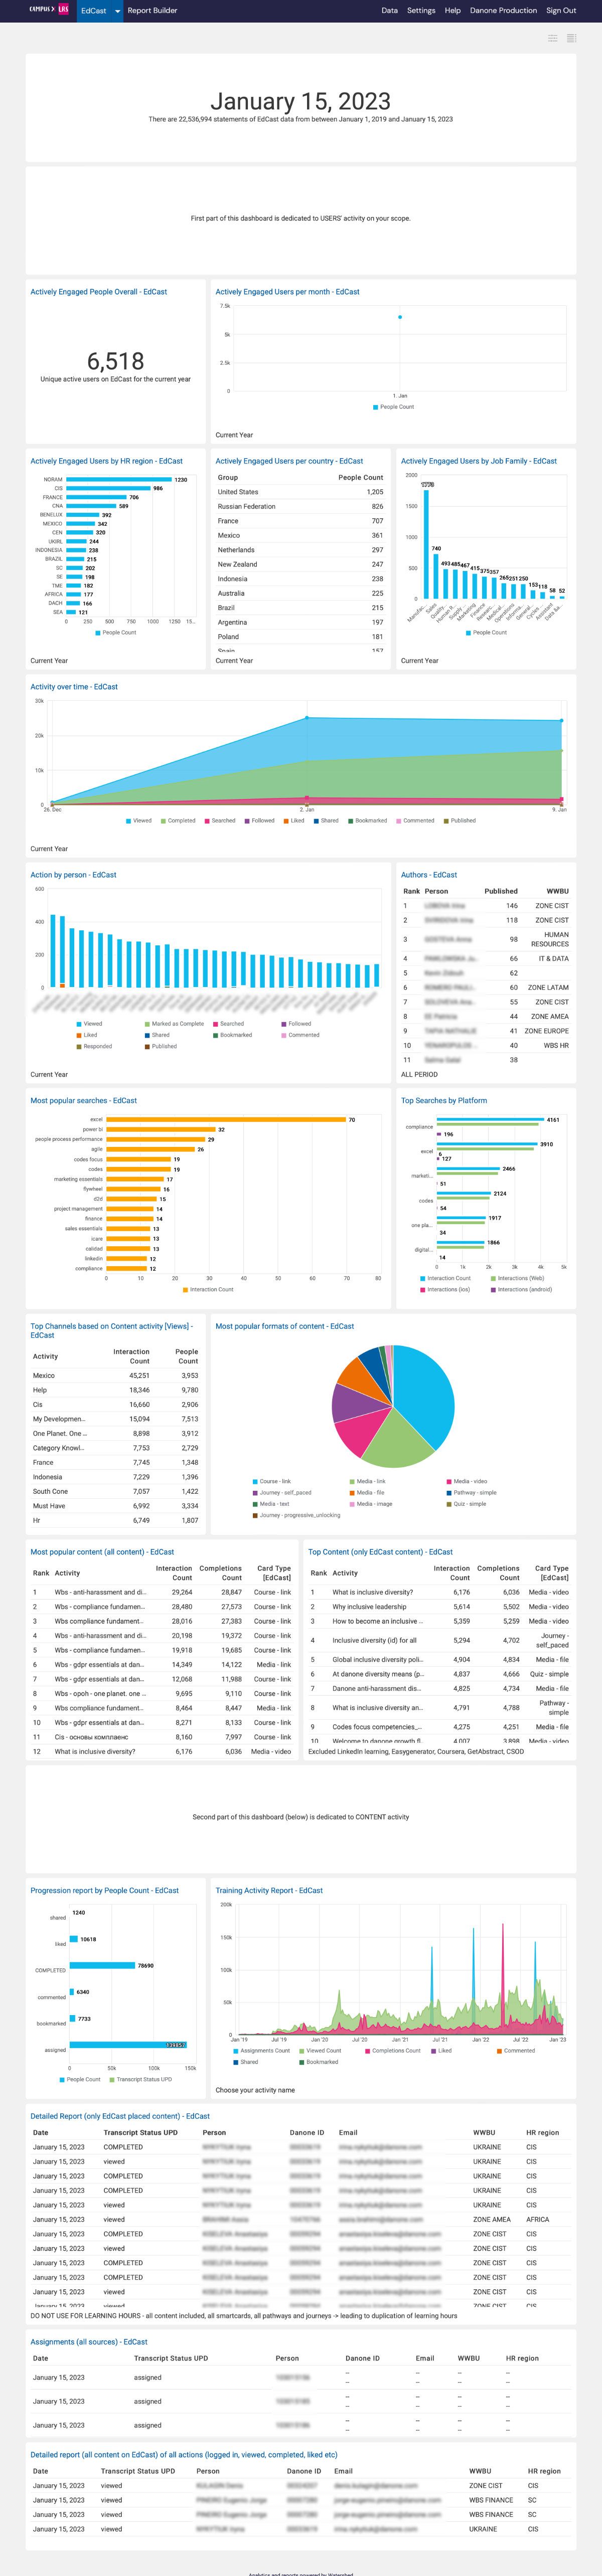
In the summer of 2022, Danone launched the completion of their project to underpin "Campus X" with an LRS. They now have instant access to the data that was previously locked away within their ecosystem.
So how does this impact measure up when we look at the numbers? At the start of the project, Danone recorded 2 million data points. These data points make up the individual elements when recording a learner interaction.
A learner interaction may look like:
- User X completed Y course in Platform Z
- User X watched 15 minutes of Video X in platform Z
Within the first 28 months of Campus X’s launch, they have recorded more than 30 million statements, or over 150 million data points. This will increase exponentially over time.
These learner statements feed into the individual learner’s “Learning Engagement Index,” enabling the development and growth of skill sets that meet organizational needs, setting the foundation to promote a learning culture that ultimately aids retention.
From here, they can benchmark their learner targets using aggregated results and study outlier results (i.e., under-and-over performance).


A scalable solution that allows the ecosystem to grow
When choosing an LRS, one of Danone’s core objectives was to ensure that new platform data could be added to their reporting dashboards as the ecosystem grows. Watershed’s choice of reusable or custom-created connectors makes this possible. In addition, Danone also has smaller, local LMSes that will be connected to the LRS via custom connectors in the project's next phase.
"Choosing a reporting solution that was scalable over time was an essential requirement. As our ecosystem is an organic one and evolves over time to support business strategy, we must have a solution that was flexible enough to continue to have real-time reporting and data-driven insights, but also very friendly to use for our team, that allow us to judge our progress and give us the insights to drive our learning strategy." —Frédéric Hebert, Digitalization Stream Lead Talent and Learning, Danone
The image above shows Danone’s ability to scale up their ecosystem and reporting at the same time. You can see the launch of LinkedIn Learning in March 2022, showing a total of 5,629 interactions relating to skills and offering immediate visibility into the success of the launch.