Enhancing the way you can slice and dice your data to give you powerful insights is always top of mind for our team at Watershed. Throughout 2023 we’ve been developing features that make it easier and quicker to understand the impact of your learning.
This blog post outlines some of our latest features and updates to linked reports, program reports, report and measure displays, and more.
Linked reports: Drill down for a more granular view of L&D data
The linked reports feature in Watershed allows users to seamlessly navigate through different reports and gain a comprehensive understanding of underlying metrics.
By linking a parent leaderboard report to a child leaderboard report, users can drill down within a report to see finer levels of detail without switching between multiple reports.
You can use this feature by adding a top-level JSON object within Watershed's advanced configuration, enabling you to link one or more report measures to another report. Clicking on the link will pull up the child report quick-filtered based on the row clicked from the parent report.
This feature is handy for filtering the child report by dimensions, measures, and date filters from the parent report.
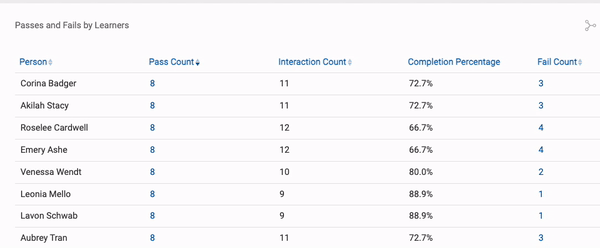
For example, the following summary report dimensioned by person can show the number of attempts taken for a test. When users click on that number in the report, they can link out to the specific information for that test, as shown below.
Recommended Reading
Program report enhancements
The Program report is one of most highly valued reports that offers an overview of a pre-defined learning program—like compliance training or new hire training.
Watch as your learners progress through courses, videos, assessments and keep up with high-level metrics like average assessment scores and competencies demonstrated. Answer common questions, such as who has or hasn’t completed parts of a learning program and share it with managers and leadership.
We’ve made several updates to this report to streamline the user experience:
1) “Hide” options display only the essential metrics that matter to you
The program report offers a lot of detail into a pre-defined learning program—such as compliance training or onboarding. Program reports can contain a wealth of information, so to make these reports more user-friendly, you can now hide certain fields using filters. This allows you to focus on the metrics that matter to you.
For example, some users may want to know how many learners haven’t started or completed their training but not how many are in progress. Similarly, some users may not need to see training progress percentages but want to see the “Completed” status.
And while users have always been able to hide several components of the Program report, the latest round of updates means you can now conceal additional components for a more customizable experience. These include:
- People in Program
- Groups section
- Average progress column
- People not started column
- People in-progress column
- People completed column
- People section
- Progress column
- Status column
2) New card view allows quicker at-a-glance progress updates
A separate feature also updates the card view of the program report. That means users can see the number of people making progress and those who haven’t started training.
Previously, the card view was restricted to the number of people in the program and the number of people who completed it. Now, users don’t need to click into the detailed view of the report to see basic information.
Recommended Reading
Enable exclusion in the simple filter editor
You can now exclude certain items—such as activities or verbs—when creating reusable filters in simple configuration, which you can then apply across multiple reports. This update aligns the Measure Editor closer to what you can already build using Report Builder's simple configuration.
Here are the items you can exclude from Watershed’s reusable filters:
- activities
- groups
- people
- verbs

Modify headings and other text in the program report
The program report’s built-in descriptive headers, such as Program milestones, may not always make sense to end users.
For instance, some organizations refer to their L&D initiatives as learning programs, while others may use terms like curriculums or training pathways. Similarly, many of the other built-in headings on program reports were previously locked and uneditable.
But now, you can customize a program report’s headings via advanced configuration to align with an organization's specific terminology.
Freeze columns on wide leaderboards
Sometimes it’s the small touches that can make a big difference to usability! You can now freeze columns on leadership boards, just as you can in Excel.
This makes it easier to scroll across through columns of information, as your eye can easily glance at the fixed columns on the left-hand side, making it easier to track data on a specific row (i.e. by name).
This example below shows the first 3 columns being fixed, so they will remain static, while all columns from ‘object-id’ onwards will scroll. Note that you can fix any number of columns you wish.
You can access this feature in Advanced Configuration and add the following to a leaderboard configuration: "fixedColumns": 3

Disable heatmap shading on a per-measure basis (highlight your core metrics only)
Previously, heatmaps shaded all measures regardless of content. This result often included text-based measures that were intended to display people and group information—such as manager or location.
Now, you can be more precise about which measures should contain shading and which ones should be ignored. This helps highlight key information and makes it easier to focus attention on trends and the ‘story’ the report is telling.
To make these changes, head to advanced configuration, add the index of the measure from the report’s measures array to the new nonShadedMeasures array. For example:
nonShadedMeasures: [0] will prevent shading for the first measure in the measures array
nonShadedMeasures: [0, 1] will prevent shading for the first two measures in the measures array
View and manage report shares in one place
Report sharing has been a longtime Watershed feature, but there wasn't a central location for users to see all report shares across the organization.
This new feature provides a central location where users can see which reports are shared. As a result, organizations can conduct security audits and revoke any old or unnecessary shares.
To access this feature, go to Settings and select Shares at the top of the menu.
See the last person to edit a CSV import template
Historically, Watershed’s list of CSV import templates hasn’t included user information about who last modified a particular template. So, as users update and edit templates, organizations might have difficulty managing these updates without knowing who made them.
But now, each template shows the last person who changed it. That means if an error arises in a template, it’s easy to see who made that particular update.

Display number and percentage within a single measure
This feature enables you to create reports with two values in one measure (e.g., a raw number along with a percentage value). Previously, you could only achieve this view through multiple measures.
This update means now you can easily and quickly view both the raw number and corresponding percentage in the same location.

Search and filter CSV import lists
Over time, a CSV imports list can get quite lengthy—especially if you've been a Watershed client for several years, as you might have more than 100 pages of imports.
So what happens if you make a mistake and need to find an old import, but you don't know exactly when it was imported? Or, do you need to wipe all the data from a specific data source? The only way was scrolling through each and every page, looking for the specific imports in question.
With this new search function, you can search for a template or file name to generate a list of the imports in question. As a result, you save time by not having to navigate through multiple pages of imports.
Customize the display of several measure values
Due to how Watershed stores group information, you’re often required to give each group a unique identifier, usually in the form of group_type:group_name (i.e., location:new-york).
However, when displaying this information in a leaderboard, you might want to remove the “location” portion and display “new-york.” This feature allows you to do just that.
About the author

Ismael (a.k.a. “Izzy”) Lara, Director of Implementations at Watershed, has experience not only as an instructor, but also an instructional designer working with faculty to design courses that best enhance the student learning experience. Previously, he has supported the implementation of a learning ecosystem to support K-12 teachers’ professional development and currently advocates for xAPI within the L&D community.
Subscribe to our blog