From the beginning, Watershed has enabled clients to create beautiful and impactful reporting dashboards to share L&D data across their organizations. We’ve seen our clients create and share thousands of reports, and we’ve been blown away with the positive response. With all of this usage, we’ve collected feedback from our clients on how their Watershed experience could be improved so they can collect and share even more data.
We’ve been working like crazy on a big Watershed update based on this feedback, and we’re so excited to announce that we’ll be releasing new features and an update to our UI later this month!
Because some big things are changing, we’ve outlined the updates in this post and are hosting a webinar to walk you through what you can expect. That said, keep these important dates in mind:
- January 22, 2019: Full production release on our US Sandbox servers
- January 24, 2019: Full production release for the US and EU
New Watershed Features
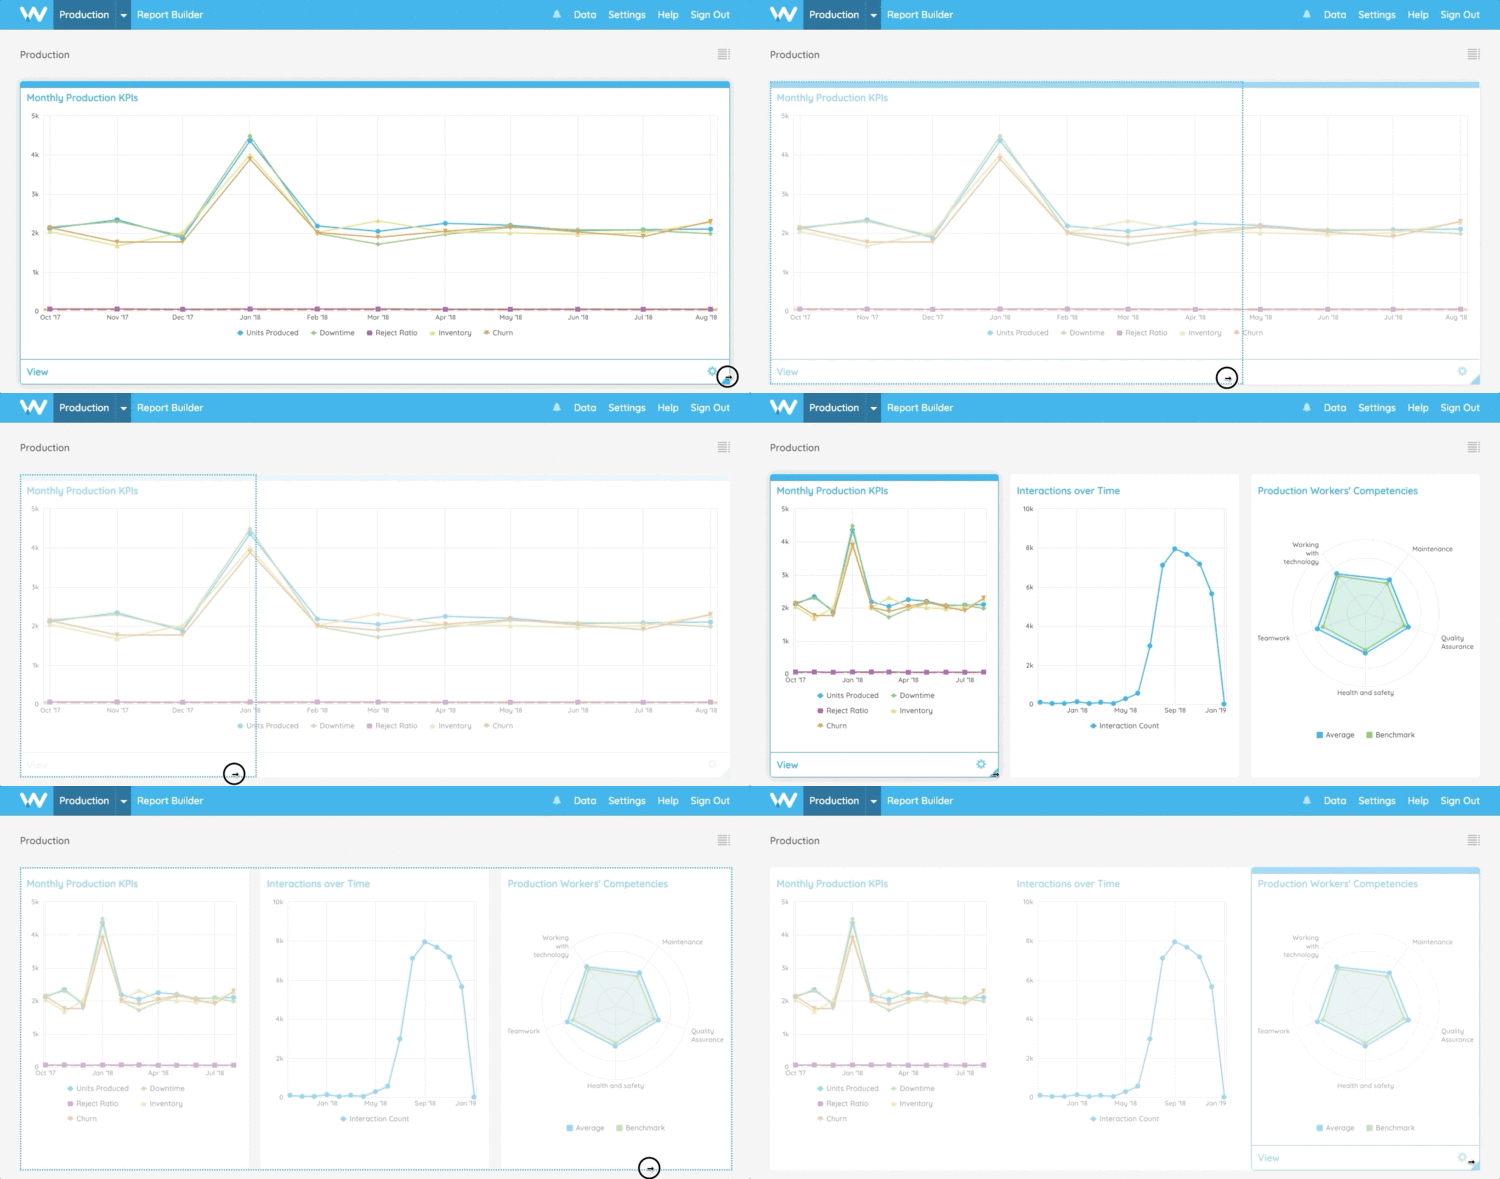
Resizable ReportsOur resizable reports allow you to highlight data that’s important to stakeholders by allowing you to make reports as big or as small as you need. Reports also have a fixed height so they lay in a fixed grid.

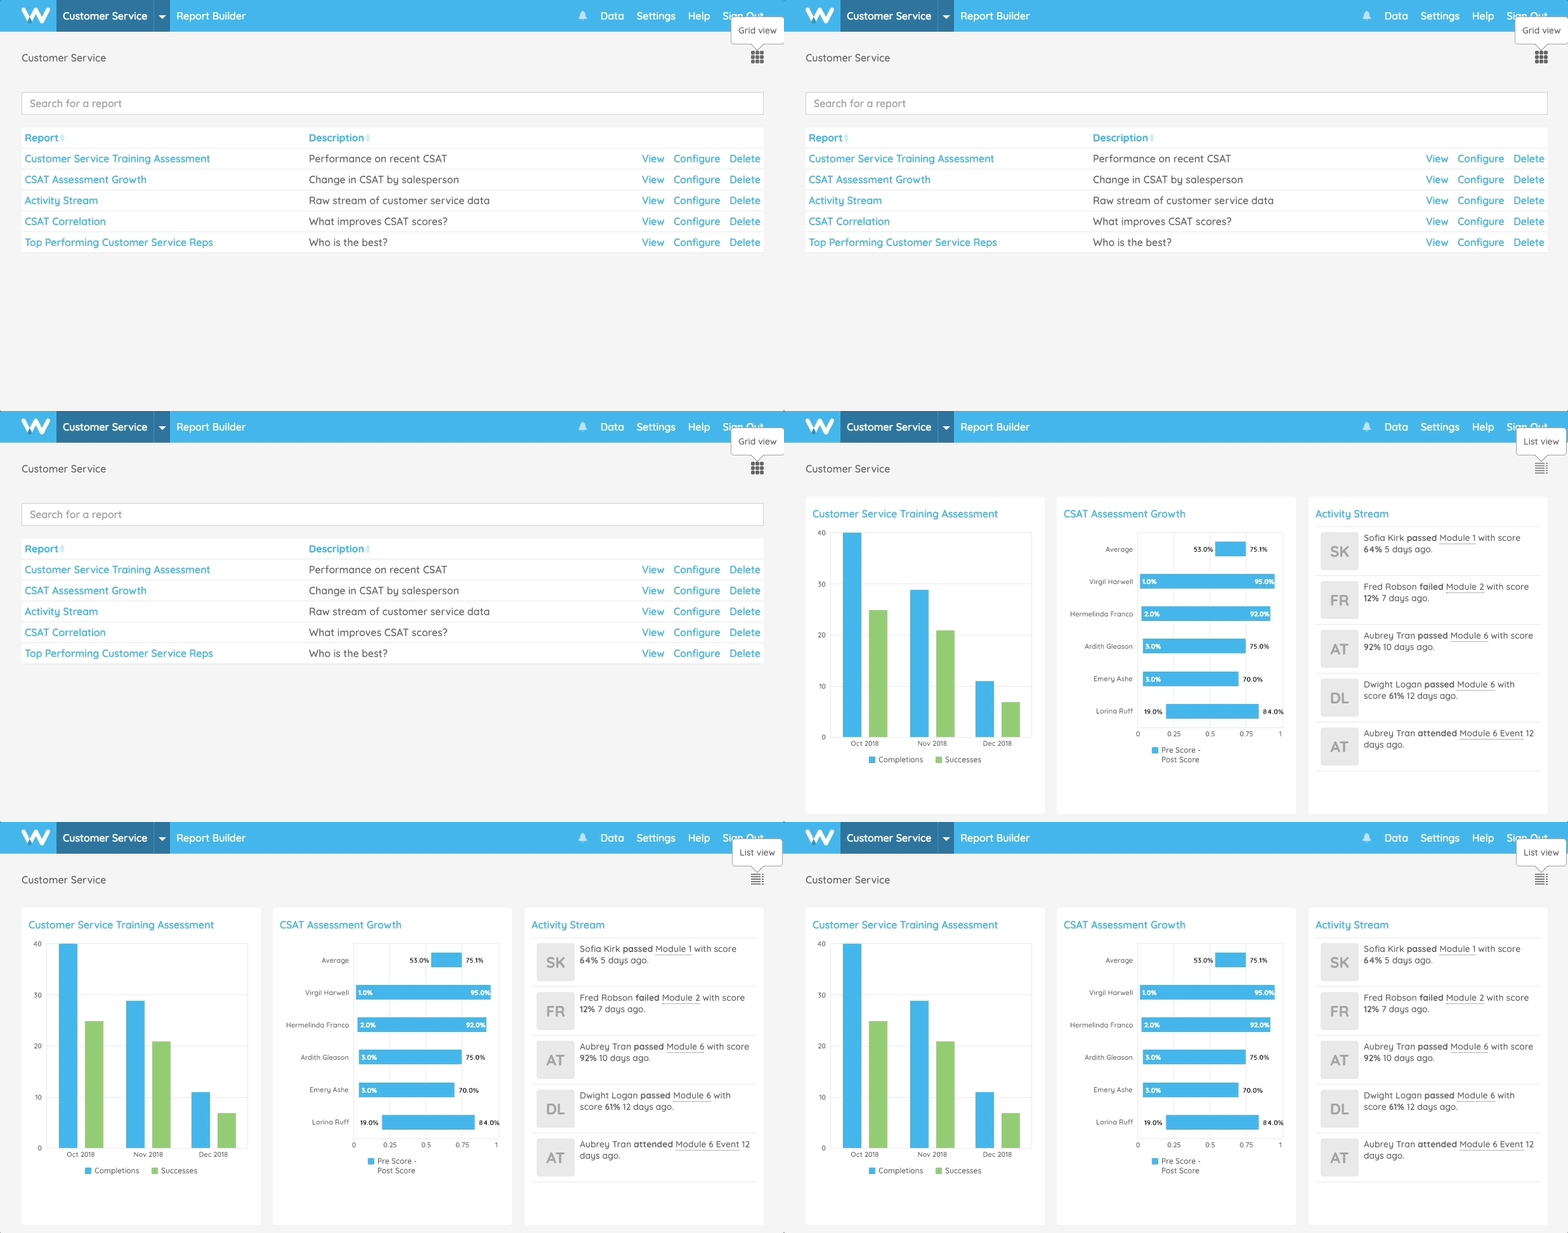
The new List View on dashboards shows a list of every report on a dashboard and provides an easy way to manage dashboards with many reports.

The new Reports page in Settings lists every report in your organization and provides direct access to their configurations. Like the List View for individual dashboards, this helps admins manage a large number of reports.
Recommended Reading
Enhanced Style & Function
In addition to new features, we’ve improved the consistency of Watershed’s overall look and feel to help you onboard new users quickly.
Usability Improvements
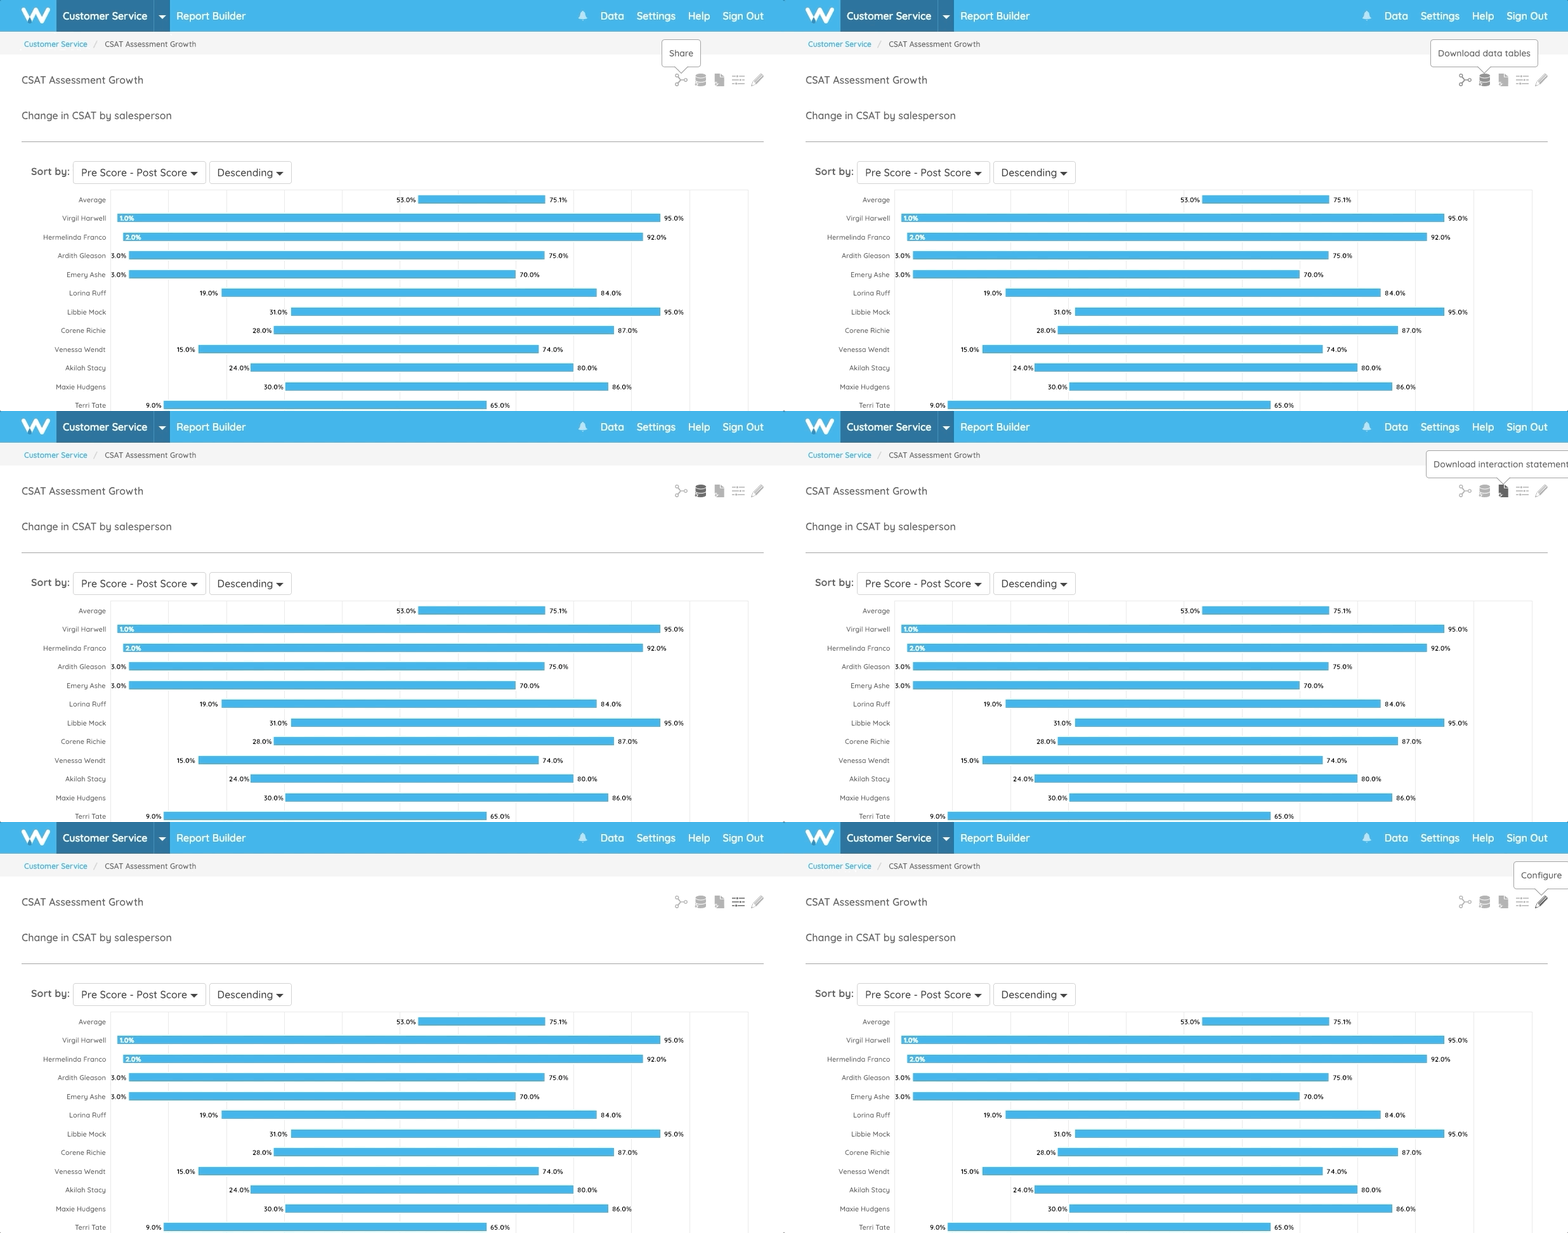
Colors, fonts, and buttons have been updated. Many text buttons have been replaced with icons in report headers, dashboard headers, and quick filters. Hover over any icon to learn what it does.

Quick Filters’ appearance have been updated to match the Report Builder, and, by default, will be turned on for new reports and dashboards. Additionally, you now have the ability to select multiple filters at one time.
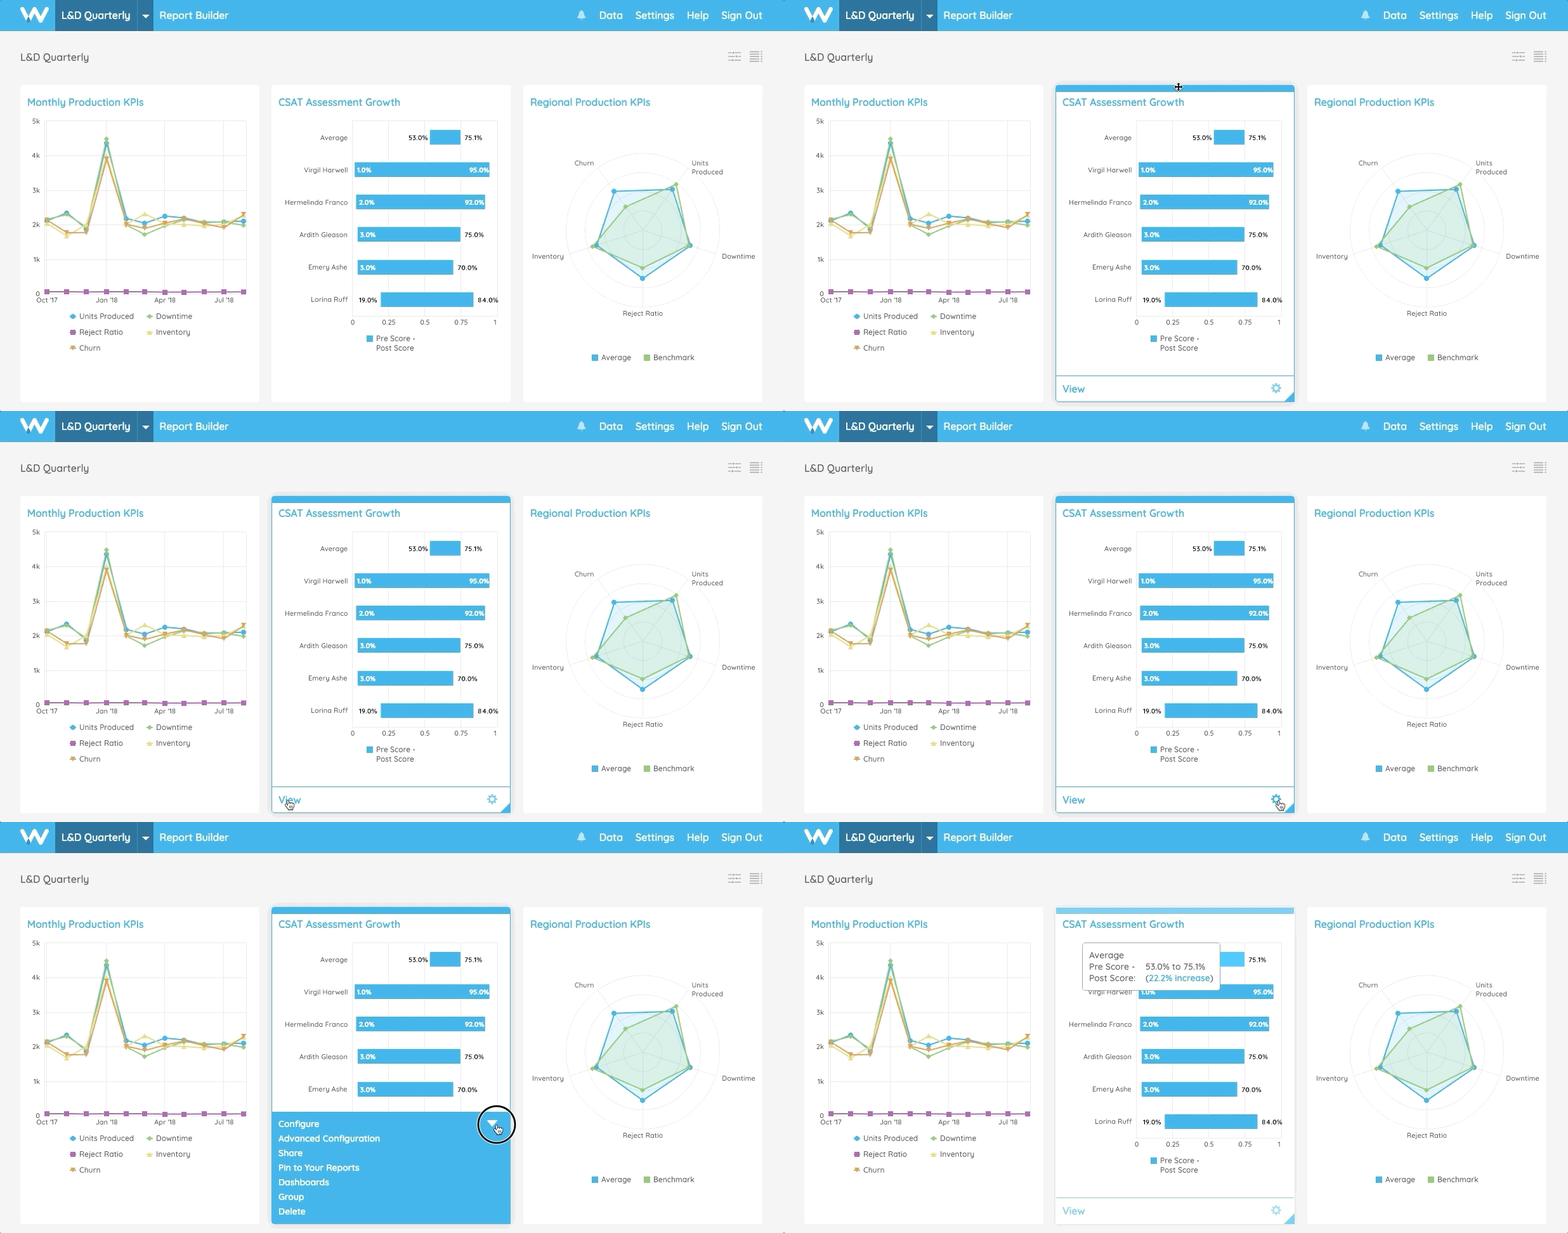
On Dashboards, the ability to move reports, the View link, and the report options menu is hidden until you hover over the report. The ability to move reports on dashboards is now a bar at the top of reports, and default text for report summaries has been removed.

Scatter report configuration will use the same measure selection control as the other report types.
- Watershed’s report creation tool, Explore, is now Report Builder.
- Your Dashboard is now Your Reports.
- The More link on reports is now View.
- xAPI Data Sources in Data is now xAPI Data
- Other Data Sources in Data is now CSV Data
- Explore Access page in Settings is now Report Builder
- Data has been moved next to Settings in the app header.
- The Download Interactions Statements link on reports has been moved to the report header at the top of the page next to the Download Data Tables link. Both are now icons.
- Data Search has been moved up in the Data menu
- If your Watershed login is a member of more than one organization, the link to the list of organizations is now located on the right side of the main navigation menu.
Functionality for Hidden Reports and Hide Reports has been removed. Existing hidden reports will be moved to a new, editable Hidden Reports dashboard. By default, this dashboard can only be seen by Global Admins.
The ability to remove reports from dashboards, but not delete them, can be replicated using existing features.
Recommended Resource
About the author
Brooks Alford is a tenured client success and operations leader who helps companies make innovative and complex technology accessible to all.
Subscribe to our blog